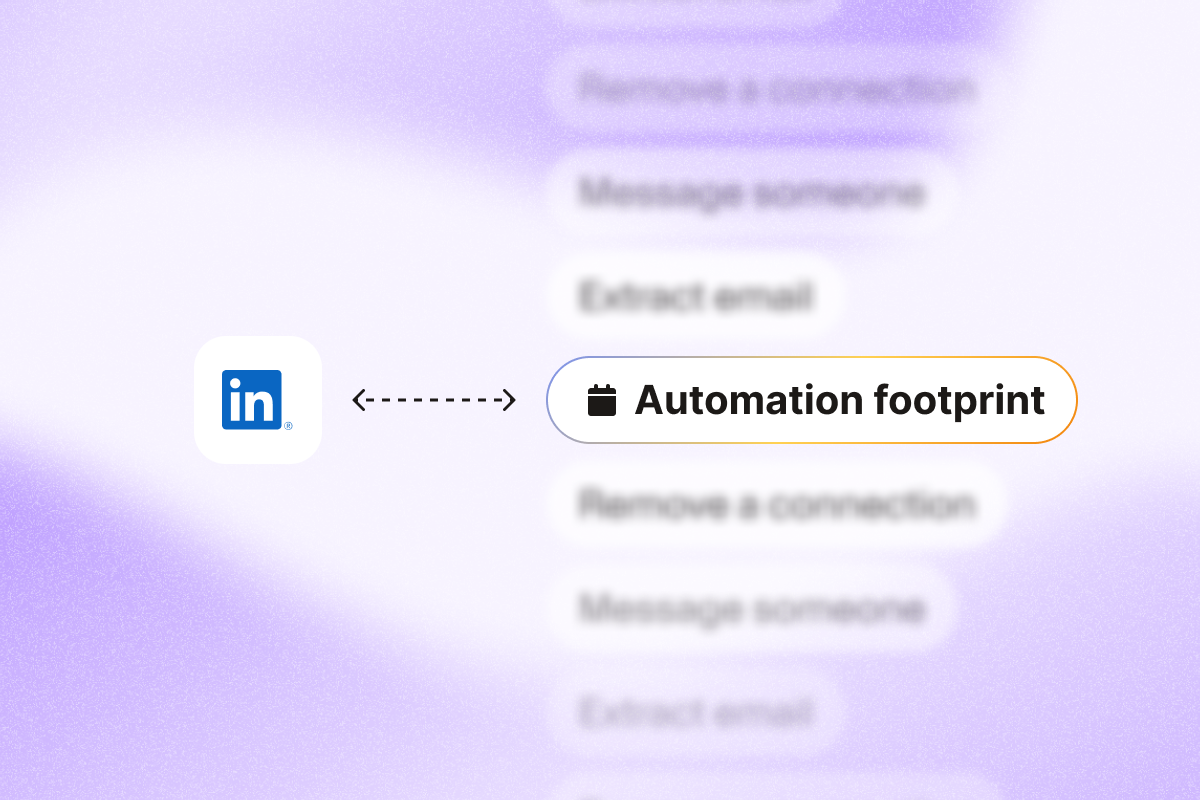
How to Tell If Your LinkedIn Automation Footprint Is Too Large
Most people who get restricted on LinkedIn aren’t being reckless. They didn’t wake up and decide to break the rules. They didn’t suddenly double their volume overnight. In most cases, they were doing what worked before, but just a little more of it.
If your LinkedIn automation footprint is too large, you usually see it in a few places first: your backlog of pending invites grows, your acceptance rate drops, and LinkedIn starts adding friction to your sessions. That’s usually the moment people start asking, “What did I do wrong?”
The answer is rarely a single number. LinkedIn reacts when your activity no longer matches your account’s normal pattern. We call it your profile activity DNA. It’s shaped by how often you act, how consistently you’ve done so, and how your network typically responds. When your activity drifts too far from that baseline—especially too quickly—risk goes up.
Each LinkedIn account has its own activity DNA. Two accounts can behave differently under the same workflow. — Brian Moran, PhantomBuster Product Expert.
This guide helps you audit your recent activity against that baseline. It shows you where early risk usually shows up, why pacing matters more than totals, and what to do when your footprint starts getting noisy.
The self-diagnosis checklist: Are you over your baseline?
Use these checks against your own recent activity. If multiple signals show up at the same time, your footprint is likely too large for your current account positioning.
1. How many old pending connection requests do you have?
Where to check: My Network → Manage → Sent.
Watch for: 100–150 pending requests older than two to three weeks. These ranges are heuristics based on observed risk patterns; your baseline may differ. A growing pile of ignored invites signals low recognition. LinkedIn reads that as low relevance, which is the same pattern its anti-abuse systems are designed to reduce. If your pending backlog keeps growing while your network doesn’t, you’re accumulating noise faster than trust.
2. What is your connection acceptance rate over two weeks?
How to calculate: Accepted connections ÷ total requests sent over a two-week window.
Watch for: Acceptance below 20–25%. If you’re under 25% for two weeks, cut volume, tighten targeting, and improve invite context. This is a heuristic based on observed patterns; your baseline may differ. Low acceptance usually means one of three things: your targeting is too broad, your profile isn’t positioned for the audience you’re reaching, or your invites lack enough context for someone to say yes. All three correlate with outreach that looks automated, even if you didn’t change volume.
If you stay under 25% for multiple cycles, you’re pushing more outbound intent than your current network positioning can support.
3. Do your sessions trigger extra verification or logouts?
Watch for: Frequent CAPTCHAs, forced logouts, repeated re-authentication prompts, or extra verification steps during normal use. This is an early signal that LinkedIn is evaluating your session behavior. Common triggers include dense action bursts, repetitive navigation, and abrupt volume jumps.
Session friction is often an early warning, not an automatic ban. — Brian Moran, PhantomBuster Product Expert.
One-off friction after travel or a device change is normal. But if it happens regularly, reduce activity and stabilize your patterns before you add anything new.
4. Did your visibility drop without a clear cause?
Watch for: A sharp drop in profile views or search appearances without changes on your end. Visibility fluctuates for many reasons. But when a sustained drop appears alongside session friction or outreach issues, it can indicate account-level enforcement effects.
If you see a sustained 30%+ decline for two weeks without changes to posting or targeting, review your recent activity and reduce volume. This is a heuristic; compare against your own baseline.
Why patterns matter more than daily totals and limits
A sharp jump in activity after a quiet period is often riskier than steady, higher volume. LinkedIn often reacts more to change over time than to totals. At PhantomBuster, we call this the slide-and-spike pattern, where activity slides down, then spikes up.
If you run LinkedIn outreach with PhantomBuster, schedule runs to spread actions across the day and ramp weekly, so your pattern shifts gradually instead of spiking.
Avoid slide-and-spike patterns. Gradual ramps outperform sudden jumps. — Brian Moran, PhantomBuster Product Expert.
Here‘s what it looks like in practice:
- Weeks 1–3: 5 connection requests per day
- Week 4: 50 connection requests per day
LinkedIn doesn’t publish detection criteria; the following are patterns we observe in accounts that avoid friction:
- Pace and density per session: How many actions you take and how quickly, within a single session.
- Consistency across days and weeks: Whether your usage follows a stable routine or shows bursts.
- Anomalies versus your baseline: Whether you introduced a new behavior pattern too suddenly.
What should you do if your footprint looks risky?
Step one: reduce noisy signals
- Pause automation for 48 hours: This breaks the anomaly pattern, giving you a clean window to observe normal behavior again.
- Withdraw old pending requests: Remove connection requests that are older than about two weeks. This reduces the “ignored invite” backlog signal.
- Use LinkedIn manually for a few days: Browse normally, engage lightly, and send a small number of invites with clear context. The goal is to re-establish a stable baseline.
- Resume with stable timing, not a rigid schedule: Avoid fixed intervals and long action streaks. Keep sessions short, spread actions across the day, and ramp gradually so your baseline adjusts over time. In PhantomBuster, use scheduling and delays to randomize timing and spread activity across the day.
Step two: Diagnose before you assume enforcement
When actions fail or results drop, use the CAP/BLOCK/FAIL framework before assuming enforcement.
- CAP: Are you hitting a product or commercial limit? Check InMail credits, search caps, account-type limits, or Sales Navigator usage ceilings. These are visible limits with clear boundaries.
- BLOCK: Does LinkedIn show a warning or restriction? Look for explicit prompts about unusual activity, temporary limitations, or verification requests that appear right when you take an action.
- FAIL: Did your automation setup fail to execute? UI changes, page variants, or selector drift can cause silent failures that appear to be throttling but aren’t. Confirm with a manual parity test: try the same action in the browser and see if it completes.
Quick reference: warning signs at a glance
| Signal | What to Check | Risk Range |
| Pending requests | My Network → Manage → Sent | 100+ older than two weeks |
| Acceptance rate | Track for over two weeks | Below 20–25% |
| Session friction | CAPTCHA, forced logouts, repeated re-authentication | Happens regularly |
| Visibility | Profile views, search appearances | Sudden sustained drop alongside other signals |
| Activity spike | Compared to the last two weeks | Large step-change after a quiet period |
What’s the takeaway?
Your automation footprint isn’t about daily totals. It’s about whether your recent behavior still aligns with your profile’s activity DNA. Use the checklist above to catch the signals that tend to show up first: pending invite backlog, declining acceptance rates, session friction, and sudden spikes after quiet periods.
LinkedIn’s systems prioritize consistent, human-like usage over speed. Bursts create noise. And noise is what makes both LinkedIn’s systems and your results start to wobble. If you build LinkedIn workflows in PhantomBuster, design for stable routines, track acceptance and pending backlog, and treat session friction as a signal to slow down and re-check your workflow. Don’t panic—slow down, stabilize, and review your workflow.
Ready to operationalize this? Start a steady, scheduled LinkedIn workflow in PhantomBuster and ramp gradually week over week.
Frequently asked questions
How can I tell if my LinkedIn automation footprint is too large for my specific account?
When your activity stops matching your profile activity DNA. Look for observable signals: a growing backlog of old pending invites, consistently low acceptance rates, and repeated session friction, such as logouts or re-authentication prompts. If effort is increasing but results are decreasing, your outreach pattern likely looks abnormal for your account.
What are the earliest warning signs that LinkedIn is detecting unusual behavior?
Session friction is the earliest warning: forced logouts, repeated re-authentication, CAPTCHA, or extra verification prompts during normal use. Treat this as a signal to reduce activity and stabilize your routine.
Why do sudden increases in LinkedIn automation activity trigger more risk than steady usage?
LinkedIn enforcement is pattern-based. A sudden ramp-up creates a slide-and-spike anomaly, which means change over time can matter as much as the absolute volume. Consistent pacing tells a believable behavioral story.
When actions stop working, how do I tell CAP vs. BLOCK vs. FAIL?
Use the CAP/BLOCK/FAIL framework instead of assuming LinkedIn throttling. CAP is a visible product limit, such as credit or search caps. BLOCK shows explicit warnings, restrictions, or verification prompts often preceded by session friction. FAIL is an execution issue caused by UI drift or a selector mismatch. Confirm with a manual parity test before changing your strategy.